Dashboard
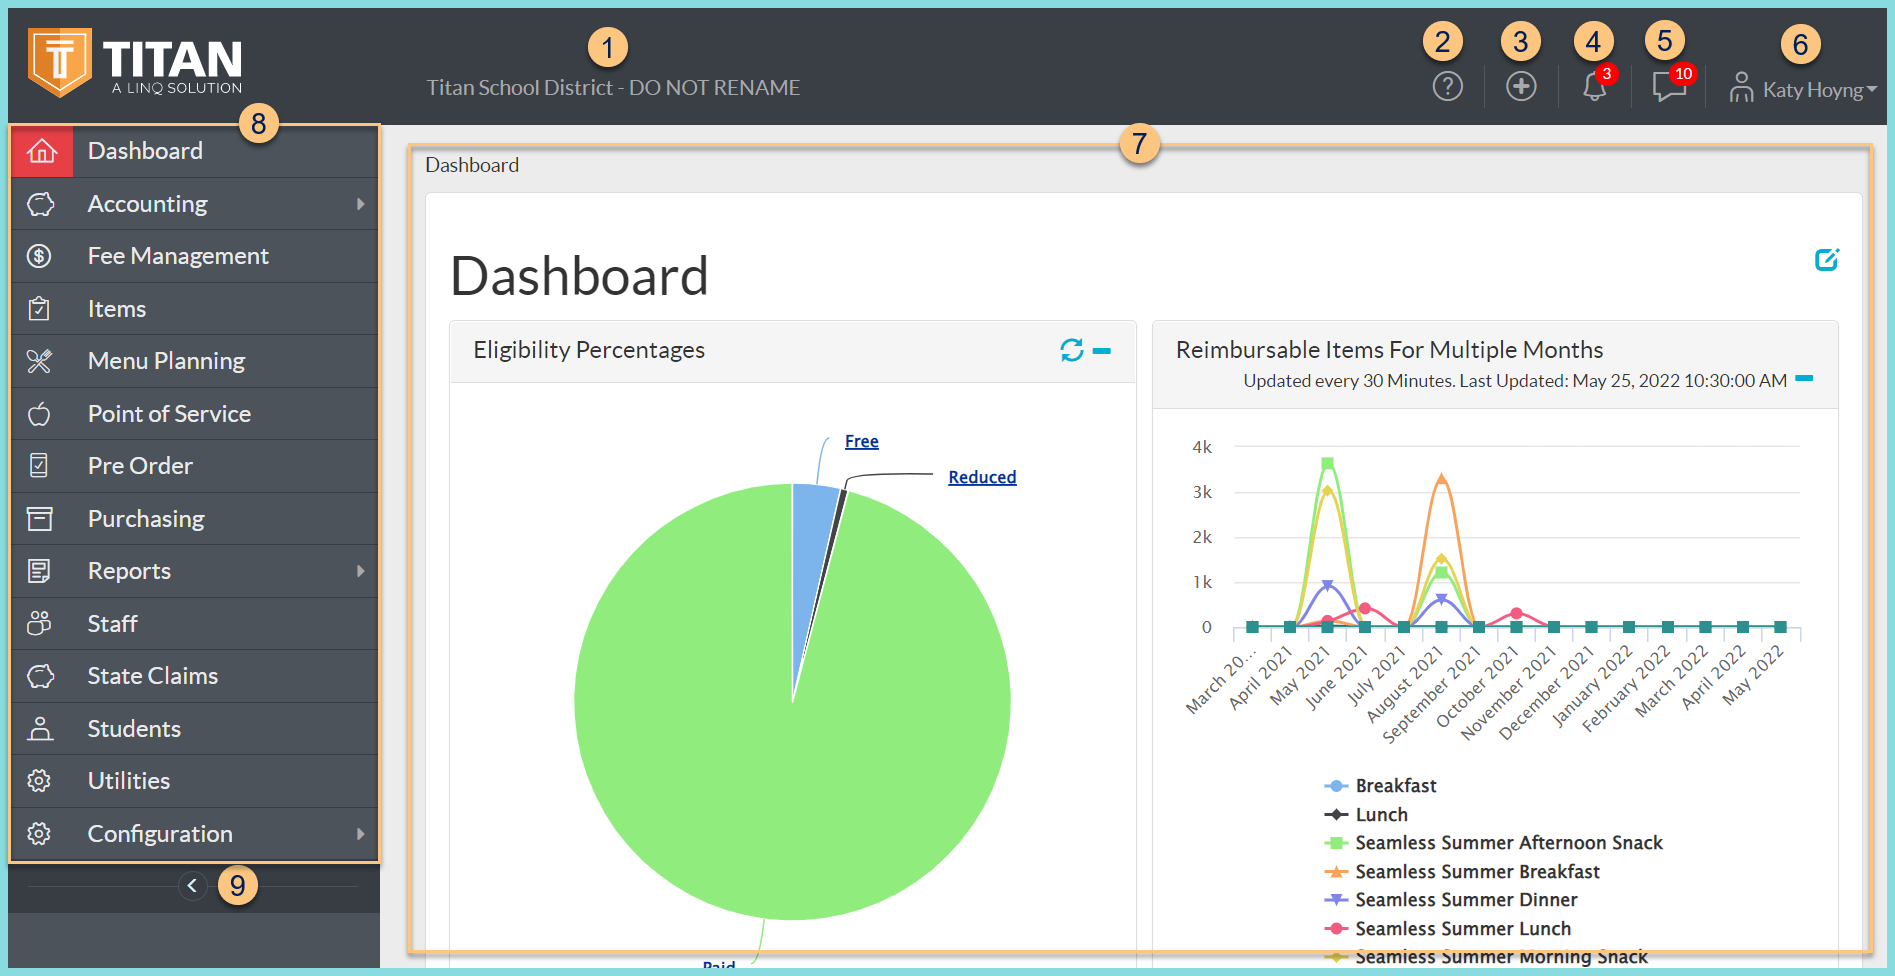
The Dashboard is the homepage of the TITAN District Portal.
-
? - click to access the Resource Center
-
(+) - click to access quick actions; options vary by module
Account Transaction - click to add an Account Transaction
Meal Application - click to add a new Meal Application
Student - click to add a new Student
Item Fulfillment - click to add a new Item Fulfillment
Item Receipt - click to add a new Item Receipt
Order - click to add a new Order
Ordering Guide - click to add a new Ordering Guide
Warehouse Transfer - click to add a new Warehouse Transfer
Item - click to add a new Item
Physical Count - click to add a new Physical Count
Vendor - click to add a new Vendor
Bank Document - click to add a new Bank Document
Customer Document - click to add a new Customer Document
Pay Sales Tax - click to pay sales tax
Vendor Document - click to add a new Vendor Document
Support Request - click to add a new Support Request -
Bell Icon - click to view the last 5 unopened reports and last 5 unopened tasks for which the user was notified
All Jobs - click to view All Jobs
All Tasks - click to view All Tasks -
Messages - click to view the last 4 unopened messages from TITAN
All Messages - click to view All Messages -
User - click to view user options
Select District (TITAN and enterprise staff only) - click to select a district
Clear District (TITAN and enterprise staff only) - click to clear the current district and select a new district
Profile - click to be redirected to the user profile
Professional Standards - click to view professional standards classes logged for the user
Open Support Session - click to go to Connectwise for a support session
TITAN Academy - click to log into TITAN Academy as a district user
Log Out - click to log out and be redirected to the TITAN log in screen -
Dashboard - notice the custom configured dashboard; each user can add and customize widgets for quick display of district data
 - click to edit dashboard
(+) - click to add a widget (descriptions below)
Gear - click to change the Title and select a Structure. Click Close to return to the dashboard.
Download icon - click to save the dashboard
Undo icon - click to return to the dashboard without saving changes
Widget options:
Refresh icon - click to recalculate widget data
Multi Arrow icon - click to drag and drop the widget to a different position
- - click to collapse the widget
+ - click to expand the widget
Gear - click to customize widget options
X - click to remove the widget -
Navigation - select menu options to navigate through the system. Options vary based on active modules.
-
< - click to collapse the menu bar
Widgets
| Widget | Description | Configuration Options | Additional Views | Notes |
|---|---|---|---|---|
| Account Balance | Dollar value of selected account | Title, Accounts | n/a | |
| Announcements | List of Announcements | Title | n/a | |
| Enrolled Students | Count of currently Enrolled Students | Title | n/a | |
| Eligibility Percentages | Pie chart of Eligibility Statuses | Title | Click the slice of each Eligibility Status to see the Eligibility Determination Reason distribution | |
| Reimbursable Items | Bar graph of reimbursable meals served today. Updated every 30 minutes. | Title | Hover over data points to see actual count. | Updated every 30 minutes |
| Reimbursable Items for Multiple Days | Line graph of reimbursable meals served for the last X days (up to 10). Updated every 30 minutes. | Title, number of days | Hover over data points to see actual count. | Updated every 30 minutes |
| Reimbursable Items for Multiple Months | Line graph of reimbursable meals served for the last X months (up to 14). Updated every 30 minutes. | Title, number of months | Hover over data points to see actual count. | Updated every 30 minutes |
| Meals Per Labor Hour | Result of Meals per Labor Hour calculations. | Title | n/a | |
| Online Payments | Combined bar and line graph of online payment dollars, total transactions, and total processing fees for the last X months (up to 14). | Title, number of months | Hover over data points to see actual amounts. | |
| Today's Revenue | Dollar amount of revenue today | Title | n/a | |
| Total Account Balance | Total dollar amount of prepaid accounts | Title | n/a | |
| Total Negative Balance | Dollar amount of negative account balances | Title | n/a |